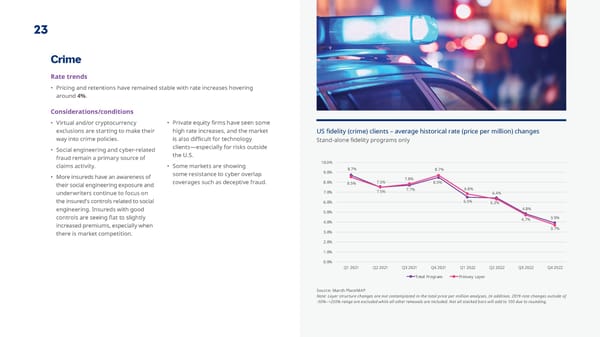
23 Crime Rate trends • Pricing and retentions have remained stable with rate increases hovering around 4%. Considerations/conditions • Virtual and/or cryptocurrency • Private equity 昀椀rms have seen some exclusions are starting to make their high rate increases, and the market US 昀椀delity (crime) clients – average historical rate (price per million) changes way into crime policies. is also di昀케cult for technology Stand-alone 昀椀delity programs only • Social engineering and cyber-related clients—especially for risks outside fraud remain a primary source of the U.S. claims activity. • Some markets are showing 10.0% some resistance to cyber overlap 9.0% 8.7% 8.7% • More insureds have an awareness of 7.8% their social engineering exposure and coverages such as deceptive fraud. 8.0% 8.5% 7.5% 8.5% underwriters continue to focus on 7.0% 7.5% 7.7% 6.8% 6.4% the insured's controls related to social 6.0% 6.5% 6.3% engineering. Insureds with good 5.0% 4.8% 3.9% controls are seeing 昀氀at to slightly 4.0% 4.7% increased premiums, especially when 3.7% there is market competition. 3.0% 2.0% 1.0% 0.0% Q1 2021 Q2 2021 Q3 2021 Q4 2021 Q1 2022 Q2 2022 Q3 2022 Q4 2022 Total Program Primary Layer Source: Marsh PlaceMAP Note: Layer structure changes are not contemplated in the total price per million analyses. In addition, 2019 rate changes outside of -50%–+250% range are excluded while all other renewals are included. Not all stacked bars will add to 100 due to rounding.
 Year-end 2022 | State of the Market Report Page 23 Page 25