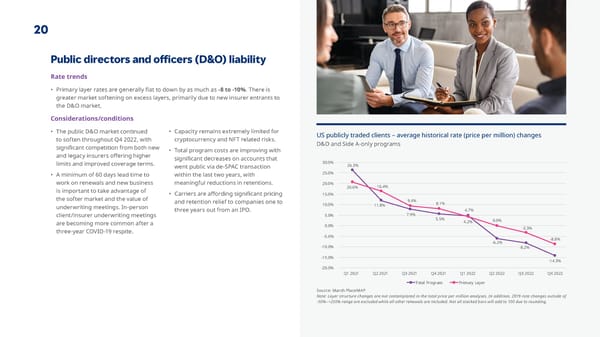
20 Public directors and o昀케cers (D&O) liability Rate trends • Primary layer rates are generally 昀氀at to down by as much as -8 to -10%. There is greater market softening on excess layers, primarily due to new insurer entrants to the D&O market. Considerations/conditions • The public D&O market continued • Capacity remains extremely limited for to soften throughout Q4 2022, with cryptocurrency and NFT related risks. US publicly traded clients – average historical rate (price per million) changes D&O and Side A-only programs signi昀椀cant competition from both new • Total program costs are improving with and legacy insurers o昀昀ering higher limits and improved coverage terms. signi昀椀cant decreases on accounts that 30.0% went public via de-SPAC transaction 26.3% • A minimum of 60 days lead time to within the last two years, with 25.0% work on renewals and new business meaningful reductions in retentions. 20.0% 20.6% 16.4% is important to take advantage of • Carriers are a昀昀ording signi昀椀cant pricing 15.0% the softer market and the value of and retention relief to companies one to 9.4% 8.1% underwriting meetings. In-person 10.0% 11.8% three years out from an IPO. 4.7% client/insurer underwriting meetings 5.0% 7.9% 5.5% are becoming more common after a 4.2% 0.0% 0.0% -3.3% three-year COVID-19 respite. -5.0% -8.8% -10.0% -6.2% -8.2% -15.0% -14.3% -20.0% Q1 2021 Q2 2021 Q3 2021 Q4 2021 Q1 2022 Q2 2022 Q3 2022 Q4 2022 Total Program Primary Layer Source: Marsh PlaceMAP Note: Layer structure changes are not contemplated in the total price per million analyses. In addition, 2019 rate changes outside of -50%–+250% range are excluded while all other renewals are included. Not all stacked bars will add to 100 due to rounding.
 Year-end 2022 | State of the Market Report Page 20 Page 22