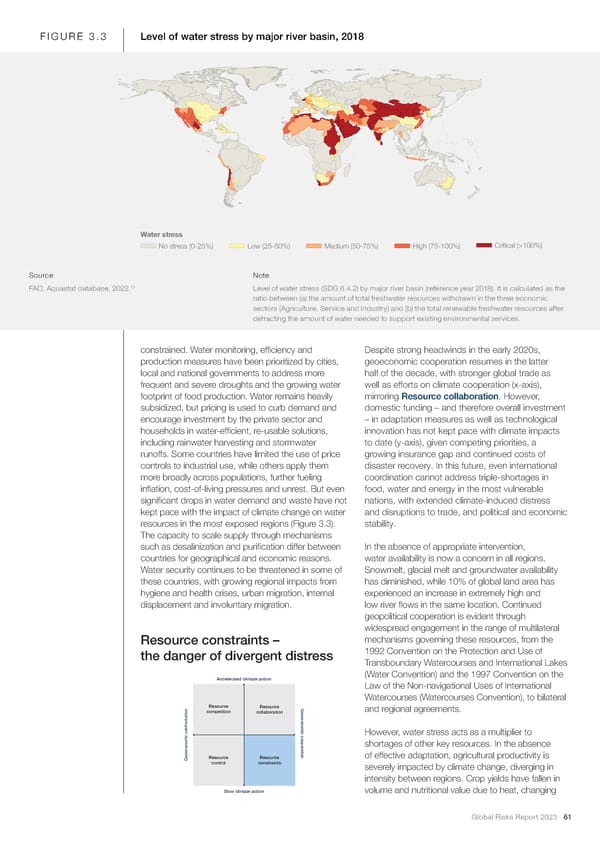
FIGURE 3.3 Level of water stress by major river basin, 2018 Water stress No stress (0-25%) Low (25-50%) Medium (50-75%) High (75-100%) Critical (>100%) Source Note 13 FAO, Aquastat database, 2022. Level of water stress (SDG 6.4.2) by major river basin (reference year 2018). It is calculated as the ratio between (a) the amount of total freshwater resources withdrawn in the three economic sectors (Agriculture, Service and Industry) and (b) the total renewable freshwater resources after detracting the amount of water needed to support existing environmental services. constrained. Water monitoring, ef昀椀ciency and Despite strong headwinds in the early 2020s, production measures have been prioritized by cities, geoeconomic cooperation resumes in the latter local and national governments to address more half of the decade, with stronger global trade as frequent and severe droughts and the growing water well as efforts on climate cooperation (x-axis), footprint of food production. Water remains heavily mirroring Resource collaboration. However, subsidized, but pricing is used to curb demand and domestic funding – and therefore overall investment encourage investment by the private sector and – in adaptation measures as well as technological households in water-ef昀椀cient, re-usable solutions, innovation has not kept pace with climate impacts including rainwater harvesting and stormwater to date (y-axis), given competing priorities, a runoffs. Some countries have limited the use of price growing insurance gap and continued costs of controls to industrial use, while others apply them disaster recovery. In this future, even international more broadly across populations, further fueling coordination cannot address triple-shortages in in昀氀ation, cost-of-living pressures and unrest. But even food, water and energy in the most vulnerable signi昀椀cant drops in water demand and waste have not nations, with extended climate-induced distress kept pace with the impact of climate change on water and disruptions to trade, and political and economic resources in the most exposed regions (Figure 3.3). stability. The capacity to scale supply through mechanisms such as desalinization and puri昀椀cation differ between In the absence of appropriate intervention, countries for geographical and economic reasons. water availability is now a concern in all regions. Water security continues to be threatened in some of Snowmelt, glacial melt and groundwater availability these countries, with growing regional impacts from has diminished, while 10% of global land area has hygiene and health crises, urban migration, internal experienced an increase in extremely high and displacement and involuntary migration. low river 昀氀ows in the same location. Continued geopolitical cooperation is evident through widespread engagement in the range of multilateral Resource constraints – mechanisms governing these resources, from the the danger of divergent distress 1992 Convention on the Protection and Use of Transboundary Watercourses and International Lakes Accelerated climate action (Water Convention) and the 1997 Convention on the Law of the Non-navigational Uses of International Watercourses (Watercourses Convention), to bilateral Resource Resource competition collaboration Geoeconomic cooperationand regional agreements. ontation However, water stress acts as a multiplier to shortages of other key resources. In the absence Geoeconomic confrResourceResource of effective adaptation, agricultural productivity is control constraints severely impacted by climate change, diverging in intensity between regions. Crop yields have fallen in Slow climate action volume and nutritional value due to heat, changing Global Risks Report 2023 61
 2023 | Global Risks Report Page 60 Page 62