

Year-end | State of the Market Report
Your future is limiteless
Year-end 2022 U.S. Business Insurance State of the Market Report
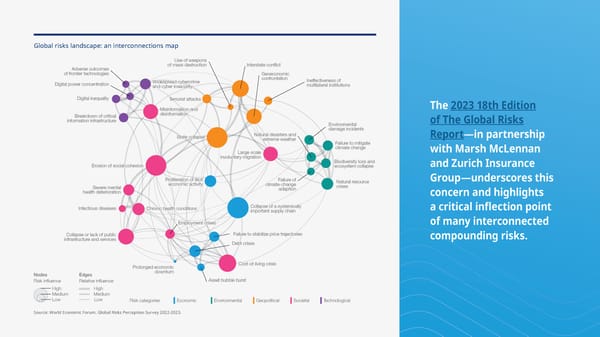
Year-end 2022 U.S. Business Insurance State of the Market Report Executive summary As reported in our Q3 2022 Business Insurance collapse, threaten food supplies and livelihoods in State of the Market Report, the property market climate-vulnerable economies, amplify the impacts continues to dominate insurance headlines. It of natural disasters, and limit further progress on will do so again in this 2022 year-end report. In climate mitigation.” addition, the 2023 18th Edition of The Global Risks Some of the risks described in this year’s Global Report—in partnership with Marsh McLennan and Risks Report are close to a tipping point. Today’s Zurich Insurance Group—underscores this concern crises in昀氀uence tomorrow’s catastrophes. and highlights a critical in昀氀ection point of many However, despite concerns of the cost-of-living interconnected compounding risks. crisis, economic downturn, economic warfare, The report also discusses the current risks facing climate action delays, and societal polarization, our natural environment. “As current crises diverts preparedness measures are possible. resources from risks arising over the medium to longer term, the burdens on natural ecosystems will Transforming challenges into opportunities grow given their still undervalued role in the global Shoring up resiliency across many di昀昀erent economy and overall planetary health,” it reads. risks can protect your bottom line over the long “Nature loss and climate change are intrinsically interlinked – a failure in one sphere will cascade run. It can even have a multiplier e昀昀ect on overall preparedness. Martin South, the President and into the other. Without signi昀椀cant policy change or CEO of Marsh, sums up our approach well: “We investment, the interplay between climate change are client-obsessed in everything that we do.” impacts, biodiversity loss, food security and natural Your future is limitless. resource consumption will accelerate ecosystem Denise Perlman, CIC Executive Vice President, Business Insurance & National Partnerships
Global risks landscape: an interconnections map Use of weaponsUse of weapons of mass destructionof mass destruction Interstate conflict Interstate conflict Adverse outcomes Adverse outcomes Use of weapons of frontier technologies Use of weapons of frontier technologies of mass destructionof mass destruction GeoeconomicGeoeconomic Interstate conflictInterstate conflict Adverse outcomesAdverse outcomes confrconfrontationontation Ineffectiveness of Digital power concentrationDigital power concentration WiWidesprdespread cybeead cybercrcrimerime Ineffectiveness of of frontier technologies of frontier technologies GeoeconomicGeoeconomic multilateral institutions and cyber insecurityand cyber insecurity multilateral institutions confrconfrontationontation Ineffectiveness of Widespread cybercrime Ineffectiveness of Digital power concentrationDigital power concentration Widespread cybercrime multilateral institutions and cyber insecurity multilateral institutions Digital inequalityDigital inequality and cyber insecurity Terrorist attacks Terrorist attacks Misinformation and Digital inequalityDigital inequality Misinformation and Terrorist attacks Terrorist attacks disinformation Breakdown of critical disinformation Breakdown of critical The 2023 18th Edition Misinformation and information infrastructure Misinformation and information infrastructure Environmental disinformation Environmental BrBreakdown of criticaleakdown of critical disinformation damage incidents information infrastructure damage incidents information infrastructure Natural disasters and of The Global Risks State collapse Natural disasters and EnvirEnvironmentalonmental State collapse extreme weather extreme weather damage incidents damage incidents Natural disasters andNatural disasters and FailuFailurere to mitigate to mitigate Report—in partnership State collapse climate changeclimate change State collapse extrextreme weathereme weather Large-scaleLarge-scale Failure to mitigate involuntary migrationinvoluntary migration Failure to mitigate climate changeclimate change Large-scale Biodiversity loss andBiodiversity loss and with Marsh McLennan Erosion of social cohesion Large-scale Erosion of social cohesion involuntary migration ecosystem collapseecosystem collapse involuntary migration Biodiversity loss and Biodiversity loss and and Zurich Insurance Erosion of social cohesion Erosion of social cohesion ecosystem collapse Proliferation of illicit ecosystem collapse Proliferation of illicit Failure of Failure of Natural rNatural resouresourcece economic activity economic activity climate-change SeverSevere mentale mental climate-change crises crises adaption Proliferation of illicit adaption Proliferation of illicit Failure of health deteriorationhealth deterioration Failure of Natural rNatural resouresourcece Group—underscores this economic activity economic activity climate-change SeverSevere mentale mental climate-change crises crises adaption health deteriorationhealth deterioration adaption concern and highlights Collapse of a systemically Infectious diseasesInfectious diseases Chronic health conditions Collapse of a systemically Chronic health conditions important supply chain important supply chain Collapse of a systemically Infectious diseases Collapse of a systemically Infectious diseases ChrChronic health conditionsonic health conditions important supply chain a critical in昀氀ection point Employment crisesEmployment crises important supply chain Employment crisesEmployment crises Failure to stabilize price trajectories Collapse or lack of public Failure to stabilize price trajectories of many interconnected Collapse or lack of public infrastructure and services infrastructure and services Debt crises Debt crises Failure to stabilize price trajectories Collapse or lack of public Failure to stabilize price trajectories Collapse or lack of public compounding risks. infrastructure and services infrastructure and services Debt crisesDebt crises PrProlonged economicolonged economic Cost-of-living crisisCost-of-living crisis downturdownturnn Cost-of-living crisisCost-of-living crisis PrProlonged economicolonged economic Asset bubble burstAsset bubble burst Nodes Edges downturdownturnn Risk influence Relative influence Asset bubble burstAsset bubble burst Nodes Edges High High Risk influence Relative influence Medium Medium LowHigh LowHigh Risk categories Economic Environmental Geopolitical Societal Technological Medium Medium Low Low Risk categories Economic Environmental Geopolitical Societal Technological Source: World Economic Forum, Global Risks Perception Survey 2022-2023.
3 Contents 19 Management and executive liability coverages 04Introduction 20 Public directors and o昀케cers (D&O) liability 06Property coverages 21 Private directors and o昀케cers (D&O) liability 22 Employment practices liability (EPL) 6 Property 23 Crime 13 Cargo/inland marine 24 Fiduciary 25 Errors & omissions (E&O) 15 Casualty coverages Cyber security/data privacy 16 Automobile/昀氀eet 27 16 General liability 16 Umbrella/excess 30 Aviation 17 Workers’ compensation 17 Environmental liability 32 Small commercial market insights 34 Claim trends
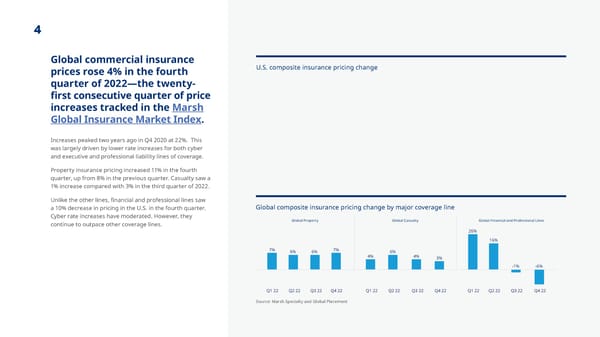
4 Global commercial insurance U.S. composite insurance pricing change prices rose 4% in the fourth quarter of 2022—the twenty- 昀椀rst consecutive quarter of price increases tracked in the Marsh Global Insurance Market Index. Increases peaked two years ago in Q4 2020 at 22%. This was largely driven by lower rate increases for both cyber and executive and professional liability lines of coverage. Property insurance pricing increased 11% in the fourth quarter, up from 8% in the previous quarter. Casualty saw a 1% increase compared with 3% in the third quarter of 2022. Unlike the other lines, 昀椀nancial and professional lines saw a 10% decrease in pricing in the U.S. in the fourth quarter. Global composite insurance pricing change by major coverage line Cyber rate increases have moderated. However, they Global Property Global Casualty Global Financial and Professional Lines continue to outpace other coverage lines. 26% 16% 7% 6% 6% 7% 6% 4% 4% 3% -1% -6% Q1 22 Q2 22 Q3 22 Q4 22 Q1 22 Q2 22 Q3 22 Q4 22 Q1 22 Q2 22 Q3 22 Q4 22 Source: Marsh Specialty and Global Placement
Property coverages Trends vary by region and industry.
6 Property We continue to experience a bifurcated market concerning catastrophic versus non-catastrophic risks. Catastrophic-prone geographies and risks are seeing far tougher coverage restrictions and the largest rate increases. This is largely due to the impact of Hurricane Ian and the escalating cost of catastrophic reinsurance treaties, many of which renewed on January 1. Regardless of the occupancy, exposure, or historical losses, the cost for property capacity is increasing while the supply has become strained. Additionally, continued in昀氀ation equates to measurable asset value growth. This brings additive cost to rate increases as noted above. While terms and conditions have remained somewhat unchanged, we are seeing newly enacted minimums for national catastrophe deductible perils, a push for higher non-catastrophe deductibles, and a developing trend from most markets to limit indemnity to the reported value for each asset. It’s very di昀케cult to predict exactly where and when the market will reach its peak, but the 昀椀rst half of 2023 is showing potential to bring some of the highest increases we have seen since this market started hardening in 2017. Increases in weather and climate disaster frequency and severity are having a signi昀椀cant impact on this already challenged marketplace.

This is a modal window.
Year-end 2022 U.S. Business Insurance State of the Market Report 7 The U.S. has sustained 341 weather and climate disasters since 1980 where 2022 in context from the National overall damages/costs reached or exceeded $1 billion (including CPI adjustment Oceanic and Atmospheric to 2022). The total cost of these 341 events exceeds $2.475 trillion. Administration (NOAA) In 2022, there were 18 weather/climate disaster events with losses exceeding $1 billion each that U.S. 2022 Billion-Dollar Weather and Climate Disasters a昀昀ected the U.S. These events included: 1 drought event 1 昀氀ooding event 11 severe storm events 3 tropical cyclone events 1 wild昀椀re event 1 winter storm event Overall, these events resulted in the deaths of 474 people and had signi昀椀cant economic e昀昀ects on the areas impacted. While the 1980–2022 annual Source: NOAA National Centers for Environmental Information (NCEI) U.S. Billion-Dollar Weather and Climate Disasters (2023). average is 7.9 events (CPI-adjusted), the most https://www.ncei.noaa.gov/access/billions/, DOI: 10.25921/stkw-7w73 recent 昀椀ve years (2018–2022) jumps to 17.8 events (CPI-adjusted) with an annual loss 昀椀gure of $120B.
8 The impacts on property insurance buyers Elevated losses are not limited to have experienced a market exodus due developed. It’s just one of many solutions what has previously been regarded to poor loss experience and continued to assist organizations manage through as the obvious catastrophic-exposed pressure from reinsurers to exit or the hard market. geographies such as Florida, Louisiana, rebalance their portfolios. There is a In summary, there is far less 昀氀exibility, Texas, and California. They have crept striking de昀椀ciency of admitted markets let alone adaptability and optionality in into the Midwest, Northeast, and other for wood frame apartments with 13R the property marketplace as it stands states as well. According to AccuWeather, suppression systems (a residential today. Reinsurance will be in sharp the damage from the 昀氀ooding in sprinkler design standard focused on focus throughout 2023 and insureds California is estimated at between $30 low-rise residential occupancies). should be prepared for more restrictive and $34 billion, encompassing both Builder’s risk coverage is another area property appetites and continued insured and uninsured property. under pressure because of climate upwards cost pressure, which is directly We have continued to witness a market implications such as wind, 昀氀ood, linked with increasing reinsurance treaty costs and in昀氀ation. Work closely with retraction from certain occupancy drought, and wild昀椀re. Coupled with classes. Habitational, senior living, food in昀氀ation, these concerns are driving MMA to uncover untapped capacity and beverage, mining, metals, wood signi昀椀cant increases in insurable values. including alternative, structured risk, and products, chemical, energy, heavy Ask your MMA representative about our parametric solutions, which can often manufacturing, and other technical risks proprietary builder’s risk panel that we mitigate these challenges. The reinsurance view from Guy Carpenter Overall, tepid reinsurer appetite and renewals were di昀昀erentiated by treaty experience in this bifurcated market. For the property catastrophe market, this was the greatest upwards shift in market pricing and contract terms seen in decades. Mercifully, a market-wide shortfall of capacity for January 1 renewals failed to materialize, with most clients securing their target orders. Demand for additional limit was tempered by price increases and concerns regarding market capacity. To reduce exposure to market hardening, insureds also reduced target limits, increased retentions, split bottom layers and/ or accepted reduced coverage. There was also de昀椀nitive pressure to reduce occurrence limits for critical catastrophic perils. The structural changes to property catastrophic programs were signi昀椀cant with 70% of North American insurers forced to take signi昀椀cant retention increases, with the median increase at 60%.
9 Rate trends • Rate increases averaged 8%–11% in Q4 2022 for larger risks and more for accounts with loss history challenges, and/or much higher for catastrophic exposed properties. • Accounts with signi昀椀cant exposure in Florida and that are predominately Our recent three-part blog series o昀昀ers additional insights: written by excess and surplus lines carriers are beginning to see rate Is in昀氀ation leaving your business underinsured? increases in the 30% to 100%+ range with an overall reduction in available capacity. Are underinsured risks hurting your bottom line? • We’ve seen signi昀椀cant momentum from carriers implementing in昀氀ation Get ahead of increased construction costs and supply chain challenges adjustments to total insured values (from 10% to in excess of 20% in some cases) on top of these rate increases that exacerbate total overall pricing. U.S. composite insurance pricing change – property
10 Considerations/conditions • The excess and surplus lines are being quoted at a minimum • Insurers are limiting their exposure marketplace has hardened at a much of 10% of the required capacity to wild昀椀re/brush昀椀re by reducing more rapid pace than the admitted limit (i.e., “rate on line”, or ROL) in the amount of capacity they are marketplace. This is the result of addition to pressure to increase the deploying. This capacity reduction poor underwriting results over the percentage deductible to 10% in is in turn driving pricing for clients past two years as well as the heavily some speci昀椀c geographies. Inland with risk for this peril. catastrophe-exposed and distressed geographies that have historically • Insurers are reevaluating 昀氀ood risks that are mostly written by this been immune to percentage named exposures and many have adjusted segment of the market. wind deductibles are now seeing their underwriting guidelines to • Loss a昀昀ected accounts will be insurers attempting to impose these address the increasing risks. extremely challenged, especially if deductibles to lessen their exposure • Capacity reductions are being seen they are structured as a shared and as these storms track inland after for high hazard earthquakes, layered program. making landfall. mainly via managing general agents • Per occurrence water damage • Bu昀昀er and excess layers will be deductibles continue to gain (MGAs) as insurers look to assume under more pricing scrutiny as scrutiny, especially for habitational greater control and limit third-party insurers will seek higher minimum risks. Generally, water damage underwriting authority. premiums. Depending on the deductibles under $100,000 are • Expect more underwriting scrutiny individual account, insurers may on vacant properties with markets also press for higher attachment di昀케cult to procure. asking to place them separately at requirements. This can lead to • Placements with signi昀椀cant much higher rates. gaps in incumbent capacity and/or exposure to secondary natural reduced capacity—all of which have catastrophe perils (i.e., severe the potential to drive additional cost. convective storm, wild昀椀re, winter • Named wind coverage capacity freeze, and water damage) may see sizable premium increases. They is becoming very di昀케cult to are likely to be subject to increased procure for exposures in Florida deductibles similar to what exist for and coastal Louisiana. Premiums earthquake and named storm perils.

1111 Year-end 2022 U.S. Business Insurance State of the Market Report 1 Understand your own risk pro昀椀le and risk tolerance threshold. »Reevaluate your risk tolerance threshold and determine if there is room to retain more risk to ease challenges. Economic volatility can impact an insured’s capital allocations and thus insurance strategies from a risk retention and risk transfer Be proactive. point of view—some insureds may be forced into higher retention structures simply because of pure economics. »It is important that organizations review third-party/lender requirements to understand what their obligations are and the impact increased retentions or retained risk may have with those relationships. Selective underwriting 2 Address data quality and utilize a robust asset valuation methodology. practices can present Expect even greater scrutiny to be placed on valuations moving forward with many underwriters automatically increasing values by 15%–20% on top of rate increases. The upside is organizations will more likely avoid underinsurance concerns when surprises in this challenging insurers enforce replacement cost values but you also don’t want to buy more insurance than needed. Every organization property marketplace. should review its current values (at least annually) and be prepared to explain the valuation methodology used. »Insurers are pressing for higher insurance-to-value interruption values with renewed interest to understand Every risk is di昀昀erent and comes with its own using their in-house and/or outsourced appraisal models the impact on a per location basis. We continue to see unique challenges. MMA is here to help you due to historical under valuations coupled with in昀氀ation, requests for insureds to complete business interruption through these challenges and uncertainties. Here supply chain, cost of labor, and material price increases. worksheets prior to quoting and binding coverage, and are some examples of how your organization can »Accurate valuations are truly a moving target due to we expect this trend to continue. Determine if you need demonstrate superior risk attributes to manage to increase business interruption limits knowing there are costs. Every step you can take toward making the current demand on appraisal 昀椀rms, as well as the complications associated with the supply chain and delays insurers comfortable with underwriting your risk requirements to appraise unique equipment—the latter with rebuilding in a timely manner when losses occur. can reduce costs in the long run. being an area in which few appraisers have experience. »Special attention needs to be paid to occurrence limit of »Insurers are over-correcting. It’s critical to bring forth liability endorsements. They have the potential to limit the a robust methodology on asset valuation in order to provide as much directional data to insurers as possible. indemnity to the reported value of each asset (i.e., building, »In addition to the proper building and equipment contents, and equipment) at each reported location. These valuations, insurers also remain focused on business indemnity clauses are limitations to the coverage and should be removed completely where possible.
12 3Budget wisely and inform senior leaders within your organization that uncertainties in the property marketplace—especially catastrophe-exposed assets—could have negative e昀昀ects on your property coverage terms and/or pricing. 4There’s no “one size 昀椀ts all” approach when it comes to managing risk. MMA has a track record for strong performance in any market conditions through our broad market access. Work with MMA to: » Adopt a holistic loss control focus, which » Explore alternative risk solutions such as includes investment to mitigate and reduce captives and parametric insurance, especially risk. This investment not only includes when traditional risk transfer insurance annual maintenance, but immediate capital may prove too costly or unavailable. outlay to address critical loss control » In昀氀uence carriers to potentially refocus recommendations. Insureds can work with margin clauses or other coverage MMA and their insurers to prioritize the limitations to the areas of most loss prevention measures that will best minimize rate increases. signi昀椀cance instead of letting carriers use a broad brush across your entire program. » Optimize insurance purchasing decisions » Obtain, when possible, early property and design of risk transfer options. renewal commitments from carriers and » Get a thorough submission to market bind coverage quickly. at least 60–75+ days in advance of your property renewal.
13 Cargo/inland marine The cargo stock throughput market has been The cargo market sustained some losses Rate trends more balanced than the distressed property from Hurricane Ian but these were not on • Rates continue to trend 昀氀at to +5% with sector. This is evidenced by the general the same scale as the property market. losses driving higher increases. availability of capacity and robust policy terms Furthermore, it will not be subject to the and conditions such as: same reinsurance pressures but there will • We will keep a watching eye on whether still be some level of pain. London market treaty reinsurance has an impact on cargo reinsurance is often purchased rates as we move through Q1 2023. 1 No push for any percentage as part of a composite treaty that could Considerations/conditions catastrophe deductibles include other lines of coverage such as political violence or war risk. These lines • Capacity remains robust. have sustained signi昀椀cant losses over the • Stock throughput continues to be a viable Per location policy limits past year and, as a result, certain writers of option for inventory sensitive accounts 2 (with a location typically being any one building cargo risk in London may well experience insured on a selling price valuation. with 100 feet separation from one another) treaty reinsurance increases. However, the drivers behind such increases are • We continue to see more exclusions not necessarily cargo related. We may related to the Russian invasion of therefore see some of this rate pressure Ukraine as well as a new “Five Powers 3 Broad duration of cover clause translate to the direct cargo markets. If Clause” that has been driven by reinsurance requirements. This clause there is to be a trickle-down e昀昀ect, we will be in a better position to ascertain its relates to an immediate cessation of impact at the end of Q1 2023. coverage as it relates to war risk if a Control of damaged goods clause loss occurs from the outbreak of war 4 Classes that remain challenged include (whether there is a declaration of war or manufacturing, agribusiness/soft not) between any of these countries: commodities, food and beverage, food – United Kingdom processing, and any organization that has – United States of America 5 Buyer’s / seller's interest clauses a combination of 昀椀rst-party product in – France storage/transit combined with high-hazard – The Russian Federation catastrophe exposures. – The People’s Republic of China
Casualty coverages Trends vary by region and industry.
15 According to the Marsh Q4 2022 U.S. composite casualty insurance index, pricing increased by 3% (excluding workers’ compensation) and 1% (including workers’ compensation). Casualty insurance rate increases moderated in 2022. While rates remained in positive territory, double-digit rate increases certainly waned throughout the year. U.S. composite insurance pricing change – casualty 9% 8% 8% 5% 7% 6% 7% 6% 4% 4% 3% 2% 2% 1% 1% 0% -1% Q4 18 Q1 19 Q2 19 Q3 19 Q4 19 Q1 20 Q2 20 Q3 20 Q4 20 Q1 21 Q2 21 Q3 21 Q4 21 Q1 22 Q2 22 Q3 22 Q4 22 Source: Marsh Specialty and Global Placement
16 Automobile/昀氀eet General liability Umbrella/excess Rate trends Rate trends Rate trends • Average rate increases are in the 4%–9% range for clean • Rate increases have come down a bit to 2%–3% but • Rate increases continue in the 5%–10% range but risks and higher for business classes with tougher risk are higher for certain business classes. are upwards of 20% when excess of automobile pro昀椀les and large 昀氀eets. liability exposures. Considerations/conditions Considerations/conditions • With some underwriting emphasis on property Considerations/conditions • There remains a lack of monoline markets for di昀케cult risks. and automobile liability coverage lines, carriers are • The excess marketplace is still limiting their capacity. • Carriers are often quoting with more liability and tending to be more lenient with general liability. On any given tower, we are seeing carriers extend no physical damage deductible options, especially where • Market capacity is increasing and carriers have been more than $10 million per layer. This is resulting in there is loss frequency. more aggressive to win new business. more carriers on programs to 昀椀ll the towers’ need. • Automobile liability claims for commercial risks are no • We are seeing more carriers quoting with multiple • New capital has entered the market and is leading to longer simple matters and claimants are often represented deductible options. increased competition on renewals. by legal counsel. This is driving claim outcomes. • Per昀氀uoroalkyl and poly昀氀uoroalkyl substances • The war in Ukraine continues to put pressure on the market. • Bu昀昀er markets are generally more competitive than (i.e., PFAS, or “forever chemicals”) are a growing risk facultative reinsurance markets as a solution to increase • Underwriters continue to apply a higher level of scrutiny concern for underwriters. the primary automobile liability limit to the attachment on medical devices and aviation-related risks. level required by the lead umbrella carrier. • Sexual abuse and molestation coverage continues to • Most lead umbrella markets are looking to attach at $3M be di昀케cult to obtain. to $5M on large/heavy automobile 昀氀eets. • Risks involving cryptocurrency and/or NFTs remain • Punitive damage awards are on the rise when there is extremely di昀케cult to place. gross negligence on behalf of the driver/insured.
17 Workers’ compensation Environmental liability Rate trends Rate trends • Rates generally remained 昀氀at or in negative territory with • The market remains favorable with an average renewal seeing an increase of decreases of around -2% to -6%. 2%–5% for most classes of business. Site pollution polices coming out of a multi-year term along with combined form general liability/pollution policies could see higher Considerations/conditions increases in the 5%–15% range depending on operations. • Market competition is strong and most carriers are Considerations/conditions now willing to entertain monoline worker’s • Airports and companies with operations 昀椀nancial loss due to virus or disease, compensation coverage. in recycling, waste disposal, water coverage may again be available for • Some industry classes are still challenging, such as treatment, and certain types of loss from related operations. manufacturing continue to be the biggest contractors that work from heights, sta昀케ng, and mining. challenge with underwriters hesitant • Companies can expect to see • Workers’ compensation is still being leveraged to temper increased environmental justice to o昀昀er coverages previously available. initiatives at the federal and state general and automobile liability rate increases. Additionally, these industries will most levels moving into 2023. Previous likely face increased scrutiny from • New York dropped out of the National Council on national and state run environmental e昀昀orts were focused on setting the groundwork but moving forward. Compensation Insurance rating program e昀昀ective agencies with action plans being October 1, 2022, adopting their own experience developed to stop the use and begin Environmental justice considerations are expected to have an in昀氀uence modi昀椀cation methodology designed to reward strong remediation of emerging contaminants. risk management and penalize others. in permitting, compliance, and • California’s Senate Bill 216 was signed into law last • Carriers are beginning to soften enforcement decisions. Several September and requires certain licensed contractors to carry restrictions for communicable states including California, Colorado, workers’ compensation insurance, regardless of whether disease, bacteria, and virus when Michigan, and New Jersey are further they have any employees. Contractors impacted include requested as the potential impacts along in this e昀昀ort and may be looked concrete, HVAC, asbestos abatement, and tree removal. from COVID-19 become more to as an example for other states established. While environmental currently developing programs. coverage does not intend to cover
Management and executive liability coverages Trends vary by region and industry.
19 According to the Marsh Q4 2022 Overall directors and o昀케cers (D&O) market capacity throughout 2023 as risk perception becomes heightened continues to expand and is on a steadily increasing trend. amongst D&O carriers. This is especially evident in the U.S. renewal management and There is plenty of opportunity to create competition on growing number of vulnerable business sectors such as executive liability insurance most accounts, which is in stark contrast to 2020 and highly leveraged private equity investors, the dearth of early 2021. Conditions within the London management IPO and SPAC activity, and actual outcomes of pending U.S. index, pricing decreased by liability market have now been softening for more than securities class action claims brought prior to and during the COVID-19 pandemic. For the time being, however, 10% (excluding cyber). 12 months, with an increasing number of D&O programs now witnessing pricing dynamics similar to that of early the marketplace is likely to remain in a well-established 2019 (subject to risk pro昀椀le). However, many factors will softening phase for the near future with opportunities to determine if broad premium reductions may decelerate move away from excess and surplus line markets. U.S. composite insurance pricing change – 34% management and executive liability 30% 28% 28% 25% 25% 27% 28% 23% 21% 15% 11% 7% 2% 3% -6% -10% Q4 18 Q1 19 Q2 19 Q3 19 Q4 19 Q1 20 Q2 20 Q3 20 Q4 20 Q1 21 Q2 21 Q3 21 Q4 21 Q1 22 Q2 22 Q3 22 Q4 22 Source: Marsh Specialty and Global Placement
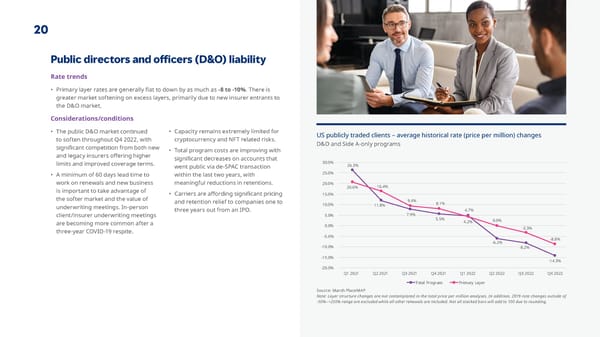
20 Public directors and o昀케cers (D&O) liability Rate trends • Primary layer rates are generally 昀氀at to down by as much as -8 to -10%. There is greater market softening on excess layers, primarily due to new insurer entrants to the D&O market. Considerations/conditions • The public D&O market continued • Capacity remains extremely limited for to soften throughout Q4 2022, with cryptocurrency and NFT related risks. US publicly traded clients – average historical rate (price per million) changes D&O and Side A-only programs signi昀椀cant competition from both new • Total program costs are improving with and legacy insurers o昀昀ering higher limits and improved coverage terms. signi昀椀cant decreases on accounts that 30.0% went public via de-SPAC transaction 26.3% • A minimum of 60 days lead time to within the last two years, with 25.0% work on renewals and new business meaningful reductions in retentions. 20.0% 20.6% 16.4% is important to take advantage of • Carriers are a昀昀ording signi昀椀cant pricing 15.0% the softer market and the value of and retention relief to companies one to 9.4% 8.1% underwriting meetings. In-person 10.0% 11.8% three years out from an IPO. 4.7% client/insurer underwriting meetings 5.0% 7.9% 5.5% are becoming more common after a 4.2% 0.0% 0.0% -3.3% three-year COVID-19 respite. -5.0% -8.8% -10.0% -6.2% -8.2% -15.0% -14.3% -20.0% Q1 2021 Q2 2021 Q3 2021 Q4 2021 Q1 2022 Q2 2022 Q3 2022 Q4 2022 Total Program Primary Layer Source: Marsh PlaceMAP Note: Layer structure changes are not contemplated in the total price per million analyses. In addition, 2019 rate changes outside of -50%–+250% range are excluded while all other renewals are included. Not all stacked bars will add to 100 due to rounding.
21 Private directors and o昀케cers (D&O) liability Rate trends • Primary renewal increases are decelerating to an average of 3%–4% and there is less pressure now to increase retentions. • Increased competition is leading to stabilization in the market. Flat, and in some cases, reductions in premium on renewals are common for favorable risks. Considerations/conditions • Carriers are more commonly o昀昀ering distressed industry classes leading to US privately held & not-for-pro昀椀t clients – average historical rate (price per million) changes automatic renewals on qualifying increased scrutiny by underwriters. D&O, D&O including EPL, and Side A-only programs accounts, requiring no underwriting • Expansion of privacy laws in additional information and generally with states are leading to additional 25.0% no changes in terms, conditions, 21.2% retentions, or premium. privacy exclusions (e.g., the Biometric 20.0% Information Privacy Act, or BIPA). 20.6% 17.4% • Entity antitrust coverage is often • Cyber-related exclusions remain 16.3% accessible to improve overall 14.8% commonplace, regardless of industry 15.0% 15.7% 13.2% coverage terms. class, and war exclusions are starting • The excess market is highly to come into play. 10.0% 11.3% 12.2% 8.7% competitive and eager to entertain 10.9% • Multi-year options are becoming 6.8% new business leading to decreasing available for small private businesses. 4.3% 5.0% increased limit factors (or the excess • There is limited market appetite for 4.6% premium charged relative to the any risk related to the pharmaceutical 3.4% 0.5% primary price). industry and underwriters are still 0.0% • Challenges remain on risks with Q1 2021 Q2 2021 Q3 2021 Q4 2021 Q1 2022 Q2 2022 Q3 2022 Q4 2022 elevated exposures, such as claims apprehensive regarding organizations Total Program Primary Layer in business for less than three years. activity, 昀椀nancial impairment, Capacity for cryptocurrency or NFT Source: Marsh PlaceMAP violations of debt covenants, merger risks is nearly non-existent. Note: Layer structure changes are not contemplated in the total price per million analyses. In addition, 2019 rate changes outside of and acquisition exposures, and -50%–+250% range are excluded while all other renewals are included. Not all stacked bars will add to 100 due to rounding.
22 Employment practices liability (EPL) Rate trends • There has been a deceleration of rate increases with most renewals coming in 昀氀at with some increasing in the 5% range. Flat to mid-single-digit increases in the rate environment may see some longevity. Considerations/conditions • More carriers are willing to write • Biometric exclusions remain standalone EPL coverage. prevalent, along with use of larger US EPL clients – average historical rate (price per million) changes high wage earner retentions. Stand-alone EPL programs only • As with D&O and other professional liability coverage lines, carriers are • High-hazard states remain an 20.0% holding the line on EPL retentions. underwriting concern, such as 17.5% However, there are exceptions to this California, Florida, and New York. 18.0% trend, including: • More often, insureds are required to 16.0% 15.8% 13.5% 13.8% – Wage and hour defense in California provide supplemental applications with 14.0% 12.7% a good narrative that explains how past 12.0% (in many instances, there is heavy 12.7% resistance to even provide wage and large losses will not be repeated. 10.0% 11.3% 11.2% 9.7% hour coverage in California) • Increased scrutiny around how 8.0% 9.0% 7.1% – Class- or mass-action defense costs employers are navigating evolving 6.8% 6.0% 6.4% – The duty to defend highly salary transparency laws and the 4.0% 4.8% compensated executives as impact this may have for EPL coverage insurers prefer reimbursement is a point of underwriting contention. 2.0% 1.0% 0.0% 0.2% • Uncertain economic conditions and • Underwriters are expressing Q1 2021 Q2 2021 Q3 2021 Q4 2021 Q1 2022 Q2 2022 Q3 2022 Q4 2022 more concern about mandatory the potential for layo昀昀s are areas of arbitration for "me too" cases, return Total Program Primary Layer underwriting attention. to work protocols, pay equity, and Source: Marsh PlaceMAP environmental, social, governance Note: Layer structure changes are not contemplated in the total price per million analyses. In addition, 2019 rate changes outside of -50%–+250% range are excluded while all other renewals are included. Not all stacked bars will add to 100 due to rounding. (ESG) rami昀椀cations.
23 Crime Rate trends • Pricing and retentions have remained stable with rate increases hovering around 4%. Considerations/conditions • Virtual and/or cryptocurrency • Private equity 昀椀rms have seen some exclusions are starting to make their high rate increases, and the market US 昀椀delity (crime) clients – average historical rate (price per million) changes way into crime policies. is also di昀케cult for technology Stand-alone 昀椀delity programs only • Social engineering and cyber-related clients—especially for risks outside fraud remain a primary source of the U.S. claims activity. • Some markets are showing 10.0% some resistance to cyber overlap 9.0% 8.7% 8.7% • More insureds have an awareness of 7.8% their social engineering exposure and coverages such as deceptive fraud. 8.0% 8.5% 7.5% 8.5% underwriters continue to focus on 7.0% 7.5% 7.7% 6.8% 6.4% the insured's controls related to social 6.0% 6.5% 6.3% engineering. Insureds with good 5.0% 4.8% 3.9% controls are seeing 昀氀at to slightly 4.0% 4.7% increased premiums, especially when 3.7% there is market competition. 3.0% 2.0% 1.0% 0.0% Q1 2021 Q2 2021 Q3 2021 Q4 2021 Q1 2022 Q2 2022 Q3 2022 Q4 2022 Total Program Primary Layer Source: Marsh PlaceMAP Note: Layer structure changes are not contemplated in the total price per million analyses. In addition, 2019 rate changes outside of -50%–+250% range are excluded while all other renewals are included. Not all stacked bars will add to 100 due to rounding.
24 Fiduciary Rate trends • Middle-market accounts are generally seeing rate increases averaging 10%. Depending on plan characteristics, rate increases can be much higher for large de昀椀ned contribution plans. • Smaller account renewal terms remain stable. Considerations/conditions US 昀椀duciary clients – average historical rate (price per million) changes • The 昀椀duciary market remains • More insurers are adopting Stand-alone 昀椀duciary programs only challenging for employee stock a conservative pricing and ownership plans (ESOPs) where we retention requirement approach 35.0% are seeing a continued push for on larger accounts. higher premiums and retentions, even • Underwriters are doing more plan 30.0% 29.5% where adjustments have been made performance and fee structure due 26.8% over the past one to two years. An diligence with the intent to cap fees. In 25.0% 23.5% 23.4% 23.6% insured’s risk pro昀椀le really matters in addition, it is becoming more necessary 22.8% 19.9% 20.0% 21.9% the 昀椀duciary market. to provide supplemental applications • Excessive fees remain a top outlining strong risk mitigation and 18.3% 19.0% 17.7% 13.8% 15.0% underwriting concern with prevention measures for these risks so 12.3% 10.5% potential for separate class action underwriters can manage uncertainty 10.0% and/or excessive fee retentions. as respects to record keepers, advisors, 8.0% and plan administrators. 5.0% 6.0% $100M 401(k) plan assets seems to be the plan size 昀氀oor for excess fee • Primary carriers are hesitant to o昀昀er 0.0% underwriter scrutiny. Q1 2021 Q2 2021 Q3 2021 Q4 2021 Q1 2022 Q2 2022 Q3 2022 Q4 2022 increased capacity ($10 million in Total Program Primary Layer limits are less frequently available). Source: Marsh PlaceMAP Note: Layer structure changes are not contemplated in the total price per million analyses. In addition, 2019 rate changes outside of -50%–+250% range are excluded while all other renewals are included. Not all stacked bars will add to 100 due to rounding.
25 Errors and omissions (E&O) Rate trends • Rates remain stable because of competition and ample capacity, with some risks able to obtain rate decreases. • As with D&O, there is less pressure now to increase retentions. Considerations/conditions • There are signs of increased • There has been no improvement capacity leading to more with technology risks, stabilized pricing, with carriers cryptocurrency, or NFTs as they willing to combine D&O and E&O present signi昀椀cant risks. Coupled in one policy. with coverage ambiguity between • Major carriers are exhibiting more E&O and cyber, underwriters remain apprehensive to provide broad underwriting 昀氀exibility than in enough coverage that is meaningful. previous quarters. • Challenging risks, such as • Health care related technology E&O remains di昀케cult, particularly manufacturers E&O, certain real for insureds providing software estate-related classes, mortgage to hospitals to manage their brokers, and startup E&O for billing processes and/or protect franchises often require excess and surplus lines markets. con昀椀dential information. • Lawyers’ professional liability remains di昀케cult if certain areas of practice include wills and trusts, patent prosecution, or con昀氀icts of interest (which is most often an alleged wrongful act).
Cyber security/ data privacy Trends vary by region and industry.
27 Cyber security/data privacy Average U.S. cyber price per million trends for all industries Rate trends Considerations/conditions Quarterly cyber rate changes for MMA clients • Rate increases averaged 25% in Q4 • There have been significant changes 2022. However, we can sometimes in the cyber market. With a risk that 70.0% has good security in place and 60.9% get to near 昀氀at when leveraging 60.0% competition and helping highlight without recent claims history, the 57.9% an insured’s solid security posture market has become very competitive 50.0% 49.7% and controls. with all major players now looking to 41.2% • For some organizations that have increase their premium income. 40.0% 39.8% substandard security controls Marketing renewals to a broad array 35.1% of carriers will likely produce 30.0% (which are often small businesses), significant reduction in premium for 25.1% 24.9% they may experience declinations such insureds. As previously 20.0% or higher rates in the 30%–50% mentioned, the market remains very 12.9% range—but nowhere near what was 10.1% 8.0% experienced in early 2022. difficult for insureds that do not have 10.0% solid security in place. • Premium reductions for good risks • Capacity challenges remain in terms 0.0% may be achievable, particularly on Q2 2020 Q3 2020 Q4 2020 Q1 2021 Q2 2021 Q3 2021 Q4 2021 Q1 2022 Q2 2022 Q3 2022 Q4 2022 larger accounts and/or those that of limits desired, requiring the development of more complex have sought alternative options in layered towers. Source: Marsh PlaceMAP, U.S. Marsh McLennan Agency Data the marketplace. • Excess cyber coverage rates have been decreasing, providing some relief on the primary coverage lines as well. • Some carriers are considering pricing relief because of new exclusionary Cyber risk resiliency language being deployed on new and renewing accounts. Review last years’ completed cyber application to identify problematic responses and address mid-term via our Cyber Resiliency Network, if needed.
28 Considerations/conditions (continued) • Furthering the ongoing push for tighter security controls, some underwriters are Claims trends putting more focus on larger organization’s IT operations as they would any other board- level review. Mergers and acquisitions Social engineering fraud and Bracing for increased cyber regulations • Challenged industry classes continue to include transactions remain a major continued ransomware threats • In August, Florida became the second education, health care, municipalities, private target for cyberattacks. • Social engineering attacks have state to forbid its governmental equity 昀椀rms, managed services providers been leading to fraudulent agencies to make ransomware (MSPs), technology, and manufacturing. payments and have outdistanced payments following a similar rule • Some newer market entrants are including Attackers are becoming more ransomware losses in 2022. passed in North Carolina in May. cybersecurity controls with the insurance successful at leveraging IT However, the latter has increased Other states could join in passing purchase and some existing markets are tools against victims because in severity. other cyber-related laws. However, being more proactive in providing resources it is the easiest way to remain the e昀昀ectiveness of such laws remains to help insureds prevent cyber incidents. In undetected when in昀椀ltrating • Indiscriminate attacks due to the in question as public sector entities many cases, these improvements can make the systems and data. ransomware-as-a-service model are on the rise and are predicted to be (including education) traditionally di昀昀erence in deciding who an insureds best among the biggest threats to the have the least evolved cybersecurity business partners should be. There has been a general cyber market in the coming years. practices so are particularly vulnerable • Carriers are more closely evaluating risks increase in monetization to attacks themselves. with embedded website tracking technologies of consumer data on the • More ERISA and retirement • It is imperative for all organizations to dark web. plan-related litigation concerns (meta pixel exposures). Litigation and have been arising. Where a adopt cyber controls (refer to MMA’s top regulatory scrutiny targeted at health care cybercriminal is impersonating twelve security controls) to obtain cyber organizations is now crossing over into similar Multi-factor authentication insurance which provides an additional examination of organizations across all a plan participant, or 401(k) risk transfer mechanism. (MFA) fatigue and “attacker in participants’ sensitive data is industries, largely because of expanded state- the middle” phishing are both stolen, more lawsuits of this • Assessing network vulnerabilities and level privacy and consumer laws. creative ways attackers nature are likely on the horizon. acting to strengthen resilience has • The cyber market aversion to cryptocurrency are 昀椀nding avenues around never been more important. and NFTs was further impacted by the collapse MFA controls. of FTX in November.
Additional trends and considerations
30 Aviation The aviation insurance market will likely face another hardening year through 2023 in terms of rates, coverages, and available liability limits. This is largely due to the war in Ukraine as we've extensively written about previously. Also, airline and general aviation claims are continuing to deteriorate carrier pro昀椀tability. Rate trends • Rate increases are averaging 8%–18%. Increases are expected to continue in 2023. Creative risk management approaches and placement strategies can keep your rate increases in check. Considerations/conditions • Single-pilot operation of jets continues to need a detailed strategy to place coverage in the marketplace. • The pilot shortage is getting worse and a昀昀ects every level of aircraft operator, from 昀氀ying pilots to 昀氀ight training instructors. • Carrier appetite for new business is limited and there’s continued underwriting scrutiny that is even a昀昀ecting long-term clients. MMA has ideas on how to make your submission stand apart. Being proactive with your broker and the renewal process remains the best way to Carrier appetite for new business is limited and there’s manage expectations and procure more favorable long-lasting results. – Our strong underwriter relationships are delivering positive results. continued underwriting scrutiny that is even a昀昀ecting – Access to proprietary solutions through MMA can o昀昀er huge competitive long-term clients. MMA has ideas on how to make your advantages in terms of broad coverage and a multi-year rate lock. submission stand apart.
31 Considerations/conditions (continued) • General aviation reinsurance rates continue to rise on the backs of continued claims activity. War/malicious acts reinsurance rates are rising 100% in many cases based largely on well- documented claims arising in Russia. – War/malicious acts coverage is an important consideration for aircraft and aviation operators—much broader than the name might imply. Additionally, it is often required by lienholder institutions. The common and nearly universal AVN48B clause excludes seven perils. Here is a summary of six perils that can be “bought-back” with certain conditions: ⸰ War ⸰ Strikes, riots, civil commotion ⸰ Terrorism ⸰ Malicious acts or acts of sabotage ⸰ Con昀椀scation, nationalization, seizure (foreign or domestic) ⸰ Hijacking – As an example, war coverage and seizure “buy-back” would maintain coverage for the owner and lienholder should a governmental entity con昀椀scate an aircraft. We point out the war/malicious acts coverage components because not having them can be calamitous, especially as the crisis in Ukraine continues. Work with the MMA aviation specialists to understand where you might have gaps in coverage.
32 Small commercial market insights As with all businesses, rates for small commercial risks are increasing for buyers of business owner’s policies (BOPs). Rate trends • IVANS Index is reporting BOP increases of 7.23% (up .60% from the previous quarter). • For standalone coverage lines, premium renewal rate change trends for automobile liability, general liability, property, and umbrella are all trending upwards from the previous quarter. These are baseline trends from IVANS, with double-digit increases becoming more common for risks with poor loss experience and for tougher classes of business. 6.13% Automobile liability 5.35% Umbrella (1.08% increase over prior quarter) (.10 increase over prior quarter) 5.71% General liability -1.66% Workers’ compensation (.31% increase over prior quarter) (-.64 decrease over prior quarter) 8.38% Property (.73% increase over prior quarter)
33 Considerations/conditions • Due to rate increases, most BOPs • While workers’ compensation rates need to be remarketed in order to are generally in negative territory, obtain the best pricing and terms. we are still seeing restrictions based • New business entities continue on certain classes of business such to face underwriting scrutiny and as health care, but overall pricing generally have more restrictions in is holding steady with increases of terms of coverage enhancements less than 5% (unless the insured is than established businesses. projecting payroll increases). For • Property coverage also remains start-ups, underwriters are looking for three to 昀椀ve years of credible loss di昀케cult with markets non- renewing older buildings that are history to o昀昀er a quote. not being improved. • Cyber coverage capacity has • Wild昀椀re concerns continued even improved but only when strong in areas with wide open areas not cybersecurity controls are in place, prone or subject to brush growth such as MFA. Rates are moderating some, but underwriters continue or 昀椀re concerns. Some carriers to ask questions to understand the seem to look at ZIP codes more risks, and are requiring additional than geography. supplemental applications. • Monoline automobile liability • D&O and professional liability coverage is di昀케cult to obtain and, coverage lines are beginning to generally, we are seeing high moderate but are still experiencing minimum premiums of $5,000. increases as well, with some rate increases as high as 10%–20% for D&O and 10%–30% for professional liability at renewal.
34 Claim trends Coverage denials based Increase in time to review coverage and provide coverage evaluation on application review Applications can become a part of the As coverages become more complex and insureds In addition, insureds can be prepared for the 昀椀rst phone call with an insurance contract and are increasingly struggle with gathering necessary information to adjuster by having collected: being used to review what an insured provide to their insurance company about a loss, attested to when they procured the coverage positions from carriers are taking longer • certain pieces of information such as incident reports, coverage and what was in place when to obtain. What this means to insureds is that they • copies of contracts and email correspondence regarding the loss, the loss occurred. If those two scenarios may have to address the claim at hand without • details on the sale of a product, the bene昀椀t of their carrier’s direction until they are di昀昀erent, there is the possibility of • communication with the person claiming the loss, coverage issues. Insureds can help to can con昀椀rm coverage. This can be frustrating to ensure there is no ambiguity by carefully insureds because they have a duty to involve their • copies of invoices, and reviewing all applications and making carrier but the carrier is not engaging at that point. sure responses are completed by the This is especially a concern when litigation has • any other relevant information related to the incident. individuals with the most knowledge in been 昀椀led and the insured must respond within These materials are often helpful for the adjuster to understand the that area of the business. certain timeframes or risk a default judgment. parties involved in a loss, how the loss occurred, what the loss is, who Assumptions, outdated information, or Insureds can help themselves in this situation su昀昀ered the loss, where the loss occurred, (who, what, where, when, responses that do not truly depict the by reviewing notice provisions in their policies why) which can all impact coverage. current state of operations are often at and provide a loss notice in compliance with the By having this information early, it reduces the chance that the adjuster the root of coverage denial issues. policy requirements. If there is any ability for an will have to keep coming back for additional information to review insured to estimate the potential loss amount, this is helpful as the carriers will look at that when coverage in their policy. Ultimately, the better they understand the deciding the level of an adjuster to be assigned. claimed loss, the better chance there is for a quicker coverage position.
35 Claim trends (continued) Coverage denials based on late notice We have recently seen some major court decisions the insurer commonly provides a generic note in the carrier’s favor for denial of coverage based indicating the insurer is reserving all rights under on late notice. Insurance policies have speci昀椀c the policy. This quick response is essential for conditions outlining an insured’s contractual the insured and insurers to begin the process of obligation to report matters. The problem may understanding and trying to mitigate the claim. The become more complex with wording such as “when insurer’s actions could, unintentionally, give the you become reasonably aware of a matter” or insured the impression they have coverage without something similar. The 昀椀rst steps for an insured to the understanding that coverage may respond to reduce or eliminate problems is to understand all some but not all of the allegations. obligations they have under their policies, appoint Ideally, a coverage position within 30–60 days someone within their organization to receive notice of such matters, develop a process/procedure to (based on complexity) is bene昀椀cial to ensure an review, and potentially place all carriers on notice as understanding of how the policy will respond so soon as possible per the policy conditions. the insured can plan accordingly. Unfortunately, we have seen an increase in the length of time to Additionally, depending on the type of notice and receive a coverage position. It is not uncommon to jurisdiction (a lawsuit for example), the response see an insurer take in excess of 120+ days to provide window on a potentially complicated fact pattern a formal coverage evaluation. This time is critical as can be short. Insurers are obligated to act in good the insured could be making decisions (like counsel If an insured doesn’t understand faith, and as such in many circumstances, insurers selection), which directly impacts coverage. their obligations, they should reach will take actions (such as assigning defense counsel or sending a proof of loss). With this initial action, out to their broker and legal counsel for assistance.
Looking ahead: Journey to resilience
37 As we stated at the onset, shoring up resiliency against in昀氀ation and other factors has never been more critical. Read more in the 2023 18th Edition of The Global Risks Report about the perceptions around preparedness and governance. “For better planning and preparedness, institutions must de-anchor risk prioritization from shorter-term incentives,” the report reads. “Despite regularly featuring in the top rankings, the most severe global risks – pertaining particularly to climate and nature – are those we are still the least prepared for. As global risks become more intertwined, preparedness also needs to become more of a shared responsibility between sectors, with local and national governments, business, and civil society each playing to their strengths, rather than traditional models of governments addressing market failures when they occur.” For example, innovative strategies in risk modeling could help mitigate signi昀椀cant climate-induced losses. MMA will continue to lead with informed decision-making opportunities to support you through the many challenges ahead. What to expect from Marsh McLennan Agency (MMA) MMA will work in partnership with you to create a strategic plan that aligns with your short- and long-term organizational goals. We o昀昀er choices, alternatives, and advice. MMA is your resiliency-focused risk champion. Special thanks to our MMA Business Insurance State of the Market Report contributors: To learn more, contact your MMA representative. Joanne Adams, Sidra Ali, Yvette Beaubien, Pauline Berardi, Nick Bertke, Steve Christenson, William Cilente, Kelly Ciprian, Ricardo Collymore, Drew Crank, Michael Crusco, Michael Cullen, Jonathan Fender, Tim Gallagher, Jamie Glanz, Ryan Hale, Gretchen Haney, Michael Henning, Alison Hicks, Hannah Hoe昀氀inger, Phebe Jenkins, Karen Kestle, Amy Klitzke, Patrick Kunz, Angel Lavin, Sharon Llewellyn, Edward Lloyd, Ann Longmore, Marina Mataev, Mary McCready, Kathryn Morrongiello, Mario Paez, David Parker, Karen Parker, Denise Perlman, Cindy Rains, Jenny Raveling, Denise Recifo, Manuel Ribot, Nancy Richardson, Beth Romanowski, Matthew Ross, Sheryl Ruck, Tonia Selfridge, Note: Many of the rate trend graphics contained in this report are from Marsh McLennan and may not include Lisa Setzer, Cindy Stau昀昀er, Rachel Stoneman, Martha Szmejda, Matthew Truglio, Kathy Vanderslice, small to middle-market data. Because of this, some of the rate trends within the text may not always match up Mary VonColln, Kyle White, Joe Williams, Lori Woods, Matthew Wright, Melissa Young, and Lydia Zaharia. squarely with the visuals.
About Marsh McLennan Agency Marsh McLennan Agency (MMA) provides business insurance, employee health & bene昀椀ts, retirement, and private client insurance solutions to organizations and individuals seeking limitless possibilities. With 9,900+ colleagues and 170+ o昀케ces across North America, MMA combines the personalized service model of a local consultant with the global resources of the world’s leading professional services 昀椀rm, Marsh McLennan (NYSE: MMC). This document is not intended to be taken as advice regarding any individual situation and should not be relied upon as such. Marsh & McLennan Agency LLC shall have no obligation to update this publication and shall have no liability to you or any other party arising out of this publication or any matter contained herein. Any statements concerning actuarial, tax, accounting or legal matters are based solely on our experience as consultants and are not to be relied upon as actuarial, accounting, tax or legal advice, for which you should consult your own professional advisors. Any modeling analytics or projections are subject to inherent uncertainty and the analysis could be materially a昀昀ected if any underlying assumptions, conditions, information or factors are inaccurate or incomplete or should change. d/b/a in California as Marsh & McLennan Insurance Agency LLC; CA Insurance Lic: 0H18131. Copyright © 2023 Marsh & McLennan Agency LLC. All rights reserved. MarshMMA.com